
13 Min Read
19 November 2026Hospitality real estate in India: what institutional capital is underwriting in 2026
Share
Table of Contents+
TL;DR
- The cycle is led by rate, not occupancy. In 2025 occupancy held at 63-65%, up only 1-2 percentage points, while the average room rate rose 8-10% to ₹8,500-8,700 and revenue per available room rose 10-12% to ₹5,400-5,600, which points to pricing power rather than a simple demand rebound.
- Demand is set to outpace supply. Branded-room demand in India is projected to grow at about 10.7% a year between FY2026 and FY2029, ahead of branded supply growth of about 9.5%, and brand signings reached a record of about 64,118 keys across 586 properties in 2025, up 36% on the year.
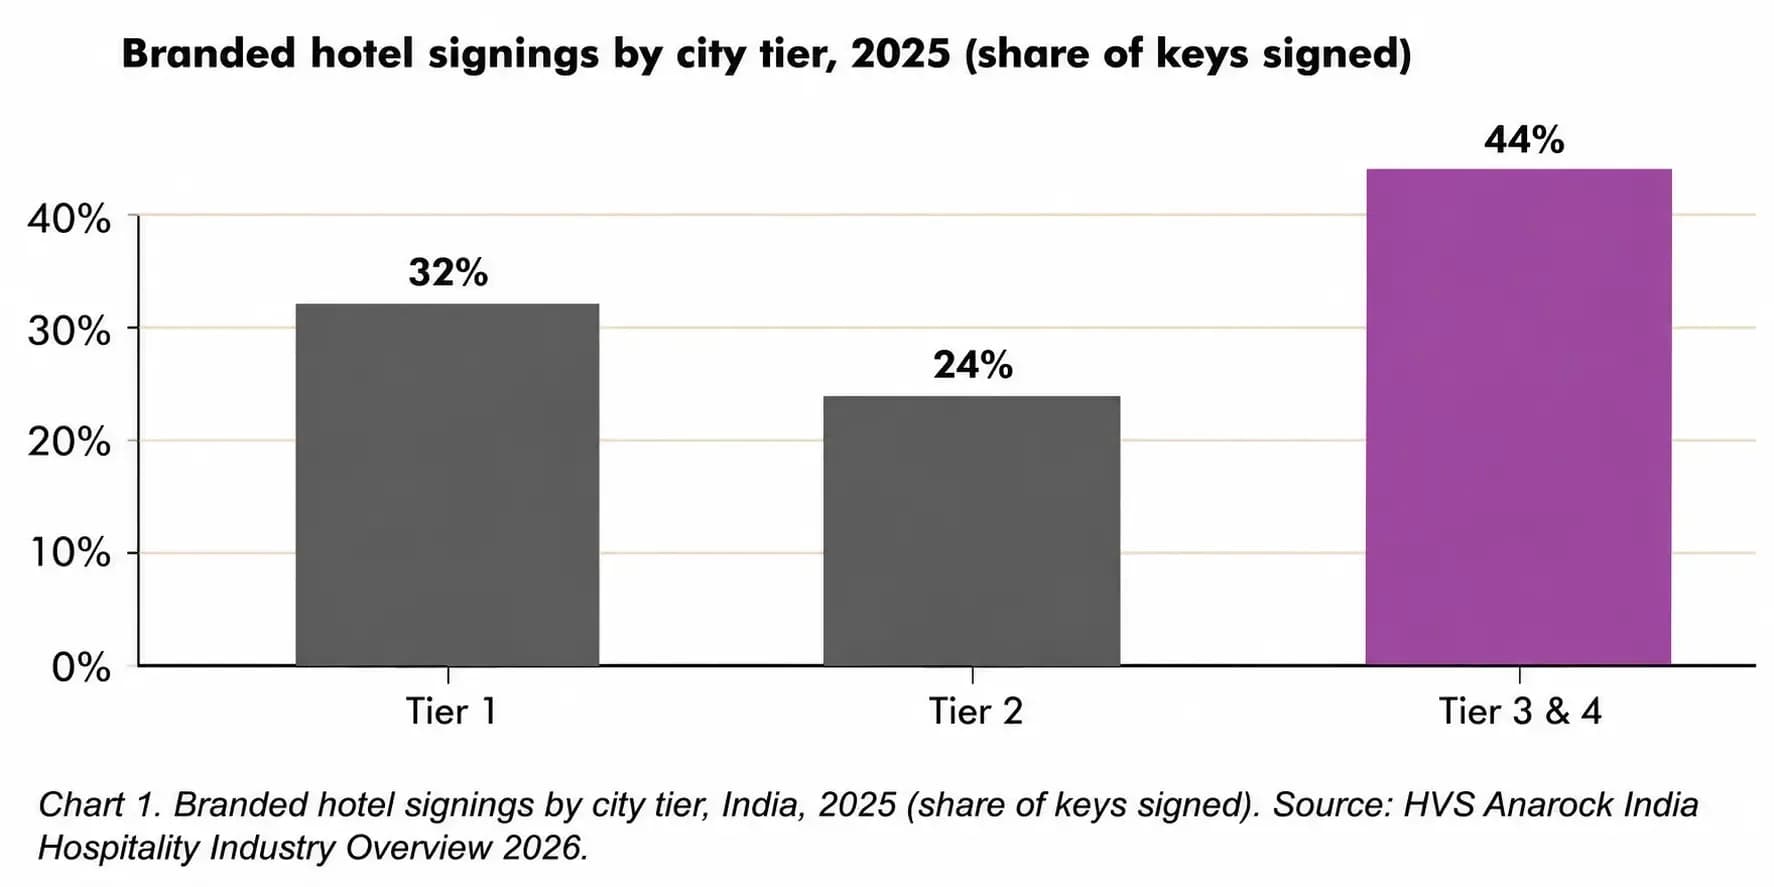
- The new supply is branded, mid-market and beyond the metros. Tier 3 and 4 cities took 44% of the keys signed in 2025 against 32% for Tier 1, and the midscale segment accounted for 55% of the properties signed, so the growth is broadening geographically and sitting mostly in the mid-market.
- Demand has diversified well past business and leisure. Domestic tourist visits reached about 4,548 million in 2025, weddings run at 8-10 million a year, and more than 34,000 live events plus large religious gatherings now create repeatable, high-yield demand windows.
- The thesis still carries cyclical risk. Quarterly performance remains seasonal and event-sensitive, with revenue per available room falling 21-23% in Q2 CY2026 from the previous quarter even as it rose year-on-year, so the rate-led strength is a trend rather than a straight line.
Introduction
A hotel in India used to be judged on one thing above all, whether it filled its rooms. That has changed. The current cycle is led by rate and margin rather than occupancy, and institutional capital is now underwriting hotels as a maturing asset class rather than a bet on recovery. The shift matters because it changes what an investor is buying: not a rebound in demand that could fade, but pricing power that is holding through a run of shocks.
The numbers behind that shift are substantial. Brand signings reached a record in 2025, room rates and revenue per room grew at a double-digit pace, and the forecast has branded demand running ahead of new supply for years. This piece sets out the case in three parts: why the performance cycle now looks structural, what exactly institutional capital is underwriting, and how it is taking the position, including the risks that still sit under the thesis.
A cycle that has turned structural
The sector has absorbed a run of disruptions, from geopolitical tension to an unusually severe monsoon and aviation shocks, without losing its pricing. That resilience, repeated now across several years, is what has moved the read of Indian hospitality from recovery to something closer to a structural growth story.
Performance is now led by rate, not occupancy
The clearest sign of maturity is in where the growth is coming from. The sector closed 2025 with occupancy at 63-65%, up only 1-2 percentage points on the year, while the average room rate rose 8-10% to ₹8,500-8,700 and revenue per available room rose 10-12% to ₹5,400-5,600. When rate rather than occupancy drives revenue, operators hold pricing power, and the additional revenue falls through to margin. For an income investor, that pass-through to margin is what matters most.
| Metric | CY2025 | Change year-on-year |
|---|---|---|
| Occupancy | 63-65% | Up 1-2 percentage points |
| Average room rate (ARR) | ₹8,500-8,700 | Up 8-10% |
| Revenue per available room (RevPAR) | ₹5,400-5,600 | Up 10-12% |
The monthly data into mid-2026 carried the same pattern. In June 2026 the average room rate rose 10-12% year-on-year to ₹7,900-8,100 and revenue per available room rose 17-19% to ₹5,056-5,346, with occupancy up 3-5 percentage points to 64-66%. The year-on-year comparison flatters June because the prior-year base was weak, but the direction, rate leading the gain, is the same one the full-year figures show.
Demand has broadened well beyond business and leisure
Pricing power holds because the demand behind it has widened. Traditional corporate and leisure travel is still growing, supported by record Grade A office absorption and better connectivity, but it is no longer the whole story. Domestic tourist visits reached about 4,548 million in 2025 and could, on historical trends, exceed 9,500 million by 2030, while total air passenger traffic reached about 420 million, with domestic flyers at 338.9 million.
Newer streams have become large and, importantly for an operator, repeatable. Weddings now run at 8-10 million a year, and the November to mid-December 2025 window alone generated over ₹6.5 lakh crore of spending across about 46 lakh weddings, with more than 60% of weddings above ₹1 crore now held at a destination. Live events have become a measurable driver too, with more than 34,000 held in 2025 and attendance up 17%, while large religious gatherings operate at a scale few markets can match, the Maha Kumbh alone drawing over 663
million visitors. For a hotel owner, these are not one-off spikes but predictable high-yield windows that can be built into a revenue plan.
What institutional capital is underwriting
A resilient, rate-led performance cycle is the backdrop, not the investment case itself. What capital is actually underwriting is a specific supply-and-demand imbalance, and a specific kind of supply, that together point to pricing power lasting beyond the current year.
Demand set to run ahead of new supply
The core of the case is that demand is forecast to grow faster than the rooms to meet it. Branded-room demand in India is projected to rise at about 10.7% a year between FY2026 and FY2029, ahead of branded supply growth expected at about 9.5%. A persistent gap of that kind sustains occupancy and lets operators keep raising rates, which is why signings have run at a record pace. Brand signings reached about 64,118 keys across 586 properties in 2025, up 36% on the year, against new openings of about 14,199 rooms across 176 properties. The gap between what is being signed and what is opening is itself a measure of how much future supply is still years from completion.
Branded, mid-market and beyond the metros
The supply being added is also shaped in a way that matters to an underwriter. Development has moved well beyond the major metros: Tier 3 and 4 cities took 44% of the keys signed in 2025, against 32% for Tier 1 and 24% for Tier 2, supported by decentralising economic activity, better connectivity and lower development costs. By positioning, the midscale segment accounted for 55% of the properties signed, with upscale and upper-upscale together at 35%, luxury at 8% and economy at just 2%.
| Positioning | Share of properties signed, 2025 |
|---|---|
| Midscale | 55% |
| Upscale and upper-upscale | 35% |
| Luxury | 8% |
| Economy | 2% |
For developers and the investors backing them, that mix is the opportunity and its limit in one. The weight of demand and development sits in branded mid-market hotels in smaller cities, where land and build costs are lower and the branded-penetration runway is longest, rather than in the trophy luxury assets that dominate the headlines.
How capital is taking the position
Knowing what to underwrite is only half the decision; the other half is how to get the keys onto the balance sheet. HVS Anarock is explicit that the usual route, building, has become the slower one, which is changing how capital enters the sector and what it has to price in.
Building is slow, so capital is also buying
A new hotel needs approvals, construction and capital, and HVS Anarock notes that the market may have moved on by the time the ribbon is cut. That lag is pushing larger players towards inorganic growth, expanding a portfolio through acquisition rather than new builds, as the sharper tool for adding keys quickly. HVS Anarock points to IHCL under its Accelerate 2030 strategy as the clearest example, assembling an ecosystem of hospitality verticals through targeted acquisitions rather than only building.
Where capital does build, the development economics are disciplined. The HVS Anarock Gleeds cost benchmark treats land as a separate strategic decision and the single largest variable component, and excludes it, along with financing costs, from the development-cost figure, so an underwriter prices the build and the land separately. Construction cost then scales predictably with positioning, through hard costs, services and fit-out, which is part of why mid-market hotels in lower-cost cities pencil out more readily than premium assets on expensive land.
What the thesis still rests on
The case is strong on direction but not free of risk, and the clearest reminder is in the quarterly data. Performance is seasonal and event-sensitive: revenue per available room in Q2 CY2026 fell 21-23% from the previous quarter on seasonality and renewed geopolitical tension, even though it still rose 11-13% against the same quarter a year earlier. The year-on-year trend is the one that matters for a long-held asset, but the swings are real, and an operator that cannot hold rate through a soft quarter will see margin move quickly.
Policy is the other open variable. The sector has pressed for infrastructure-lending status at outlays below the current ₹200 crore threshold, which would widen access to cheaper, longer-term debt for exactly the mid-scale and upscale hotels driving supply, and has flagged that denying input tax credit after the move to a 5% GST rate for lower-tariff hotels has raised operating costs for smaller properties. Neither is resolved, and both sit between the demand outlook and the returns investors finally realise.
Key takeaways
The 2025 and mid-2026 data describe a sector that has earned its structural label, with a clear investment case and clear conditions attached.
- The cycle is rate-led, which is what makes it investable. Occupancy rose only 1-2 percentage points in 2025 while rate rose 8-10% and revenue per room 10-12%, so the growth is coming from pricing power rather than a fragile demand bounce.
- The core bet is a supply-demand gap, with branded demand forecast to grow about 10.7% a year against about 9.5% for supply, a gap that record signings of about 64,118 keys will take years to close.
- The opportunity sits in branded mid-market hotels beyond the metros, where Tier 3 and 4 cities took 44% of 2025 signings and midscale took 55% of properties, and where land and build costs are lower.
- Capital is increasingly buying rather than building, because approvals and construction are slow, which puts a premium on platforms and portfolios that can be acquired at scale.
- The risks are cyclical and political, not structural, from seasonal swings such as the 21-23% quarterly drop in revenue per room in Q2 CY2026 to unresolved asks on infrastructure-lending status and GST.
Where this sits at Anarock
The hospitality advisory practice at Anarock, through HVS Anarock, advises owners, developers and institutional investors on hotel feasibility, valuation, asset management and transactions, drawing on the same performance and development-cost data behind this analysis. The research is led by Mandeep S. Lamba, President and Chief Executive for South Asia at HVS Anarock. For related reading, see the Anarock coverage of faith-led hospitality in India and of coastal tourism potential.
Frequently asked questions
How did the hotel industry in India perform in 2025?
The sector closed 2025 with occupancy at 63-65%, up 1-2 percentage points on the year, an average room rate of ₹8,500-8,700, up 8-10%, and revenue per available room of ₹5,400-5,600, up 10-12% (HVS Anarock, India Hospitality Industry Overview 2025). Because rate grew faster than occupancy, the cycle is described as rate- and margin-led rather than occupancy-led, a sign of a maturing market.
What is institutional capital underwriting in Indian hospitality in 2026?
The investment case rests on a forecast gap between demand and supply, pricing power shown in rate-led growth, and a widening, branded supply base. Branded-room demand is projected to grow at about 10.7% a year between FY2026 and FY2029 against about 9.5% for supply, while 2025 saw a record of about 64,118 keys signed, so capital is underwriting durable pricing power rather than a short recovery.
Is hotel demand outpacing supply in India?
It is forecast to. Branded-room demand in India is projected to rise at about 10.7% a year between FY2026 and FY2029, ahead of branded supply growth of about 9.5%. Brand signings reached a record of about 64,118 keys across 586 properties in 2025, up 36% on the year, while openings were about 14,199 rooms across 176 properties, so much of the signed pipeline is still years from completion.
Where is new hotel supply being built in India?
Development has moved beyond the major metros. Tier 3 and 4 cities took 44% of the keys signed in 2025, against 32% for Tier 1 and 24% for Tier 2, helped by lower development costs and improving connectivity. By positioning, the midscale segment took 55% of the properties signed, with upscale and upper-upscale together at 35%, luxury at 8% and economy at 2%.
What is driving hotel demand in India?
Demand has broadened well beyond business and leisure travel. Domestic tourist visits reached about 4,548 million in 2025, weddings run at 8-10 million a year with the late-2025 season alone generating over ₹6.5 lakh crore of spending, and more than 34,000 live events were held during the year. Large religious gatherings add scale, with the Maha Kumbh drawing over 663 million visitors, creating repeatable high-yield demand windows for operators.
How much does it cost to develop a hotel in India?
The HVS Anarock Gleeds development-cost benchmark excludes land, which it treats as the single largest and separate variable component, and excludes financing costs, so the build is priced apart from the land. Construction cost scales predictably with positioning, through hard costs, building services and fit-out, which is part of why branded mid-market hotels in lower-cost Tier 2, 3 and 4 cities are easier to underwrite than premium assets on expensive metro land.
Why are hotel companies in India growing through acquisition?
Building a new hotel takes years of approvals, construction and capital, and the report notes that the market may have moved on by the time a project opens. That lag is pushing larger players towards inorganic growth, adding keys through mergers and acquisitions rather than only new builds, with IHCL under its Accelerate 2030 strategy cited as the clearest example of assembling hospitality verticals through targeted acquisitions.
What are the risks to the hospitality investment case?
The risks are cyclical and political rather than structural. Quarterly performance is seasonal and event-sensitive, with revenue per available room falling 21-23% in Q2 CY2026 from the previous quarter even as it rose year-on-year. On policy, the sector is still waiting on infrastructure-lending status at outlays below the ₹200 crore threshold and on a resolution of the input-tax-credit issue after the move to a 5% GST rate for lower-tariff hotels, both of which affect the cost of capital and the margins an investor realises.
Sources
- HVS Anarock, India Hospitality Industry Overview 2025; CY2025 performance, demand drivers, branded signings by tier and positioning, and the FY2026-FY2029 demand and supply forecasts.
- HVS Anarock, HVS Anarock Monitor, July 2026; June 2026 and Q2 CY2026 hotel performance.
- HVS Anarock with Gleeds, 2025 Hotel Development Cost Report; development-cost architecture by positioning.
- Anarock, Hospitality advisory service (HVS Anarock).
- Anarock, The rise of faith-led hospitality in India.
- Anarock, Coastal currents: unlocking coastal tourism potential in India.