
22 Min Read
01 October 2026Commercial real estate India: the 2026 office market outlook
Share
Table of Contents+
TL;DR
- Commercial real estate India entered 2026 on a record base: Grade A office net absorption across the top seven cities hit 58.2 mn sq ft in 2025, up 17% year on year, out of 80.5 mn sq ft of total space leased.
- Pan-India vacancy eased to 16.1% from 16.5%, and average rents rose 6% to ₹92 per sq ft per month.
- GCCs are the demand engine at roughly 40% of 2025 leasing (32.5 mn sq ft), and industry estimates compiled by Anarock put the GCC market at $105-110 bn by 2030.
- Bengaluru leads with 20.0 mn sq ft of gross leasing in 2025, and on the H1 CY2026 numbers its vacancy is 10.8%. Hyderabad, at 23.5%, is the main oversupply risk.
- Only about 37% of the office stock that would qualify for a real estate investment trust (REIT) is held inside a REIT today: 198 mn sq ft of a 520 mn sq ft base across the top seven cities, per the Anarock report Powering the Next Decade (May 2026). The other roughly two-thirds is privately held, and converting it into listed form is the opportunity most institutional investors are positioning for in 2026.
Introduction
Commercial real estate in India has changed character over the past decade, and in 2026 returns are decided less by the direction of the market than by which cities and buildings an owner picks. Office space was once bought building by building, or backed through the developers who built it. Today large institutions treat it as a core holding, priced on the rent it earns and increasingly traded through listed vehicles.
The demand behind it has broadened just as much. A market that once rose and fell with technology hiring is now drawn almost as much from finance, manufacturing and flexible-space operators. Above all, it is drawn from the offshore centres that global firms now run from India.
What makes the 2026 market harder to read is that it has kept expanding while pulling apart. Grade A demand set a record in 2025 and held close to it into 2026. But the gains were not evenly shared. A small group of southern cities absorbed most of the new space, while others were left with new buildings and too few tenants to fill them.
Most of the office stock that would qualify for a listed real estate investment trust (REIT) is still privately held. So the exit route that increasingly sets what these buildings are worth is only beginning to open. For an investor, this is the opportunity that most institutional capital is now positioning for. Demand is growing and supply is tight, and neither looks like reversing soon. What an investor or an occupier has to get right is which cities and which buildings to commit to, and on what terms.
Office demand in India
Demand for Grade A offices in India held its strength into 2026, much as it had the year before. Most of that space goes to multinationals and large domestic firms that lease whole floors at a time. Because their space needs are set years ahead, this demand shifts slowly and is visible well before a lease is signed. How much space they took, and where, is what has shaped the
A record 2025 for office absorption
The Grade A office market in India entered 2026 from its strongest base on record, because occupiers took space faster than developers could finish new buildings. The clearest measure of that is net absorption, the space newly occupied over the year minus the space companies gave up. It reached 58.2 mn sq ft across the top seven cities in 2025, 17% above the 49.9 mn sq ft of 2024 and the highest on record.
Gross leasing, the total space signed for before those exits are netted off, was larger still at 80.5 mn sq ft, on the Anarock x FICCI Workplaces 2025 numbers.
Demand ran ahead of new construction. Developers delivered roughly 52 mn sq ft in 2025, up 8% on 2024, but still below the 58.2 mn sq ft occupiers took up. Occupied space therefore grew faster than total stock, and pan-India vacancy fell for a second straight year, to 16.1%.
| Metric | CY2024 (full year) | CY2025 (full year) | H1 CY2026 (latest) |
|---|---|---|---|
| Net absorption (mn sq ft) | 49.9 | 58.2 | 27.4 |
| Net absorption, year on year | - | +17% | +2% |
| New supply (mn sq ft) | 48.1 | ~52 | 22.2 |
| Pan-India vacancy (%) | 16.5 | 16.1 | 15.0 |
| Average rent (₹/sq ft/month) | 86 | 92 | 96 |
The record did not rest on a single industry, and that breadth is what makes it durable. Information technology and IT-enabled services (IT-ITeS) stayed the largest occupier sector in 2025 at 27% of leasing, down from 41% in 2021. Co-working took 23%, banking, financial services and insurance (BFSI) 18%, and manufacturing and industrial 14%, per Workplaces 2025. With those sectors now signing in similar volumes, a slowdown in technology hiring no longer empties buildings across the market the way it once did.
Office demand in 2026 so far
In 2026 demand stopped climbing but held close to the record. Net absorption in the first half rose just 2% to 27.4 mn sq ft, from 26.8 mn a year earlier, per the Anarock India Office Market Update H1 CY2026. That was a sharp step down from the 17% pace of 2025. A 2026 deal is therefore best priced on rents and occupancy staying close to today's levels, not on further gains.
Occupiers are also consolidating into fewer, larger offices rather than spreading across many small ones. Large-format deals above 0.1 mn sq ft made up 59% of the half-year's leasing.
Even as demand holds up, it is not evenly shared. One occupier group has grown faster than every other and now takes close to half the space leased in the country.
GCC leasing in India
The group driving that demand is the Global Capability Centres, the offshore offices that multinationals run for their own technology, finance and research work. GCCs have grown from a niche into the single largest source of office demand in India, and the country now hosts more than 1,700 of them, employing over 1.9 million professionals.
The economic weight behind that demand has scaled just as fast. The GCC market in India grew from $30 bn in 2019 to about $64 bn in 2024, per the Workplaces 2025 report. Industry estimates compiled by Anarock put it at $105-110 bn by 2030, a 10% compound annual growth rate (CAGR), with more than 2,400 centres.
The scale of GCC demand made them the largest single source of office leasing in 2025. They took a little over 32.5 mn sq ft of the 80.5 mn sq ft leased across the top seven cities, roughly 40% of the total. That 40% GCC share and the 27% IT-ITeS share overlap rather than add up, because GCC leasing is counted inside the IT-ITeS, BFSI, manufacturing and consultancy categories rather than as a category of its own.
GCC demand accelerated again in the first half of 2026. GCC leasing rose 22% to 19.2 mn sq ft and made up 45% of all gross leasing, against 41% a year earlier, per the Anarock India Office Market Update H1 CY2026.
In Anarock mandates, a GCC typically moves from a city shortlist to a signed term sheet over several quarters, so a strong first half is usually a reliable early read on the full year. Because demand is planned that far ahead, the best space in the strongest locations is committed well before a building is finished. That is the pattern set out in an Anarock note on how GCCs and data centres are redrawing the real estate map in India.
Where office demand concentrates
GCC leasing, and office demand more broadly, gathers in the same short list of cities year after year, overwhelmingly in the south. Bengaluru, Hyderabad and Chennai together took 58% of net absorption in the first half of 2026, or 15.8 mn sq ft, leaving the other four of the top seven cities to share what was left.
Bengaluru leads them on almost every measure. It recorded 8.3 mn sq ft of net absorption in H1 2026, up 26% year on year, and holds roughly 215 mn sq ft of Grade A stock, about 27% of the national total.
Hyderabad was the biggest mover, rising 24% to 5.2 mn sq ft as more GCCs set up there. Pune slipped to 2.6 mn sq ft after an unusually strong first half a year earlier. NCR, the National Capital Region around Delhi, took 4.3 mn sq ft, down 15%, and now trails Hyderabad.
| City | Gross leasing 2025 (mn sq ft) | GCC leasing 2025 (mn sq ft) | Grade A vacancy H1 CY2026 |
|---|---|---|---|
| Bengaluru | 20.0 | 12.2 | 10.8% |
| NCR | 15.3 | 4.5 | 20.8% |
| MMR (Mumbai Metropolitan Region) | 12.6 | 2.1 | 13.5% |
| Pune | 11.6 | 4.8 | 11.4% |
| Hyderabad | 10.8 | 4.5 | 23.5% |
| Chennai | 8.6 | 4.3 | 8.6% |
| Kolkata | 1.6 | 0.06 | 16.9% |
| Top 7 total | 80.5 | 32.5 | 15.0% |
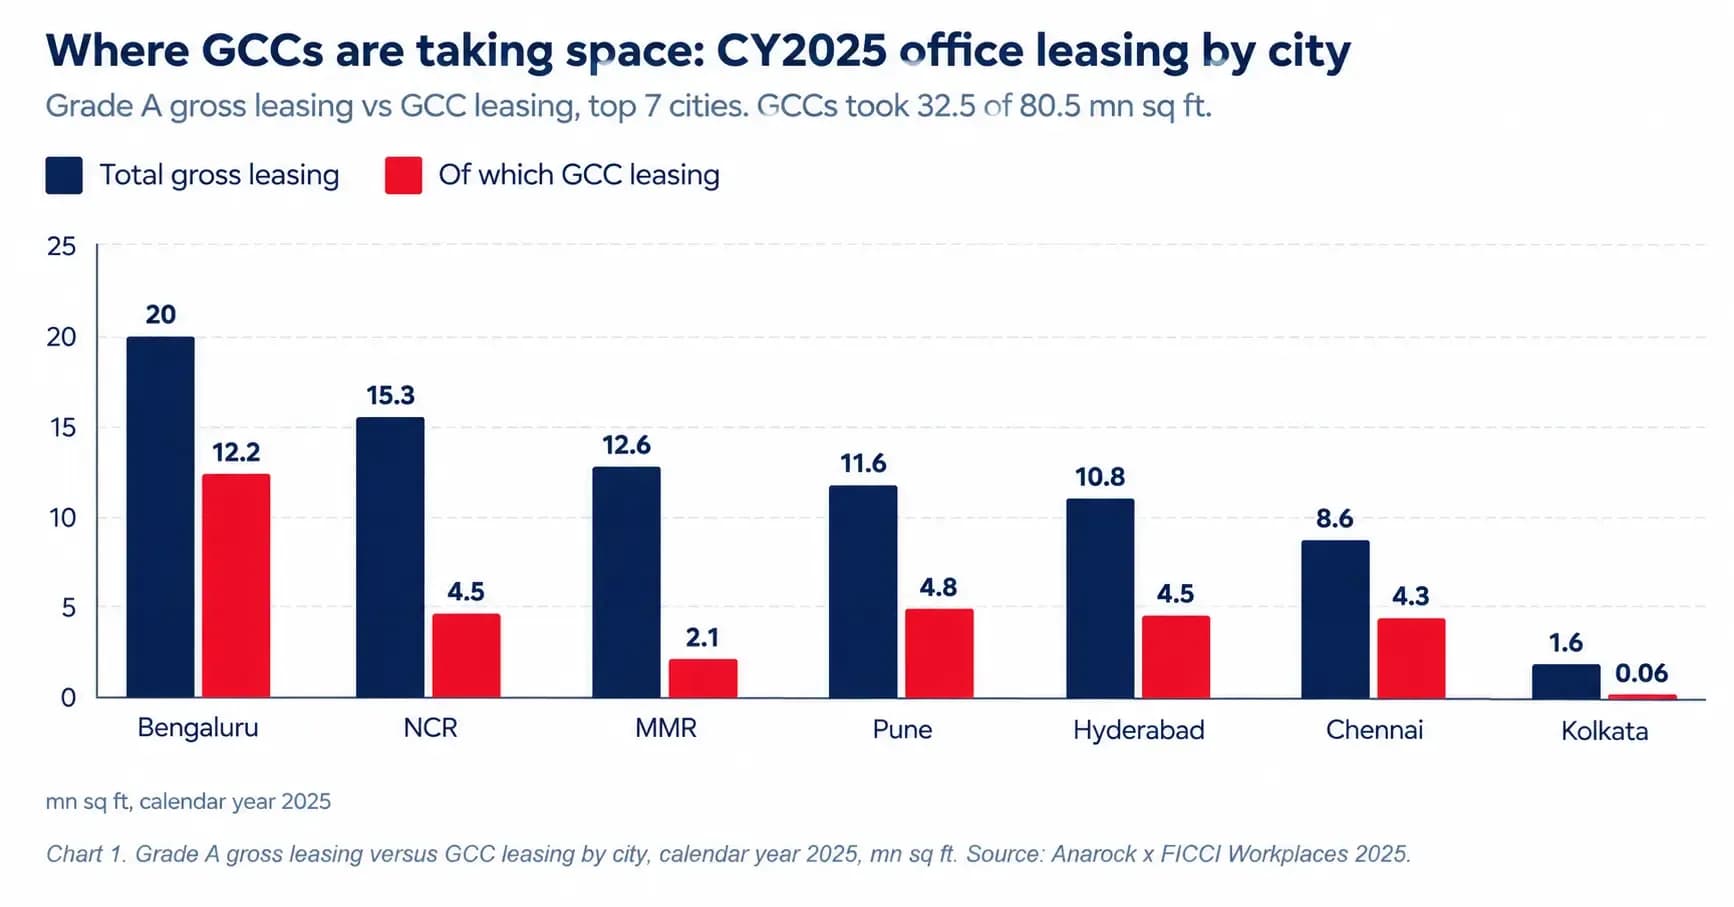
The cities that draw this demand are the ones that run tight, and how tight a city runs is the first thing that decides what an office there is worth to own.
Pricing and the exit
What an office is worth to own is set locally, one city at a time, through a chain that runs from tenants to price. Where tenants crowd in, vacancy falls. As vacancy falls, a landlord gains the room to raise rents. Higher rents lift a building's net operating income, the rent left after running costs. That income is what a buyer, or a REIT, finally pays for.
Every link in that chain is a city-level number, so a national average is the wrong instrument for pricing a single building. Pan-India vacancy and rent blend a tight, high-rent south with a softer, oversupplied set of cities elsewhere, flattering the weak markets and understating the strong ones. The first link is vacancy, and it is where the cities pull furthest apart.
Office vacancy by city
The national easing in vacancy has tilted terms mildly towards landlords. The rate fell to 16.1% at the end of 2025 from 16.5% a year earlier, and to 15.0% by H1 2026, per the Anarock India Office Market Update H1 CY2026.
Behind that 15.0% average, the cities sit far apart. On the H1 CY2026 numbers in the city table above, Chennai is the tightest market at 8.6% and Hyderabad is the weakest at 23.5%, where new supply in the IT-ITeS corridors ran ahead of demand. A buyer working off the 15.0% national number would over-rate a weak market like Hyderabad and under-rate a tight one like Chennai, misreading both ends of the range.
The spread between cities is not only a measure of risk. It also decides pricing power. Where vacancy is this low, a landlord can move the rent, and in the tight southern cities that is exactly what has been happening.
Office rents in India
Pricing power turns into higher rent fastest in the tight cities, and the national average has been rising with them. The pan-India Grade A rent climbed 6% to ₹92 per sq ft per month in 2025, per Anarock x FICCI Workplaces 2025. It reached ₹96 by H1 2026, 9% above the ₹88 of H1 2025, per the Anarock India Office Market Update H1 CY2026.
MMR remains the costliest market in India. Bengaluru leads on rental growth, with a rental index of 137.2 on a 2021 base, the highest nationally. Rents are climbing fastest in exactly the cities where GCC demand is strongest and vacancy is tightest.
Rents also vary sharply within a city, not only between cities. In Anarock advisory work, a specific lease turns less on the citywide figure than on its micro-market, the single business district a building sits in, such as Outer Ring Road in Bengaluru or the Bandra-Kurla Complex in Mumbai. A lease also turns on how much space the landlord must re-fill when current leases end. The Anarock guide to the factors to weigh when leasing office space sets out how that works, and the clauses to check in a commercial lease are covered in a companion piece.
The split between tight and oversupplied markets decides how much room there is to negotiate. A tenant finds almost none in Bengaluru or Chennai, but can still win real concessions on rent and on fit-out, the cost of turning a bare floor into a working office, in oversupplied Hyderabad and parts of NCR. For an owner the same split matters more, because the rent a tight-market building earns is both high and dependable, and dependable rent is what a building is ultimately sold on.
The REIT exit for offices
The listed REIT market is where that sale increasingly happens, and it prices a building on precisely the income its rent produces. A buyer there, whether an institution or a REIT, pays at a yield, the annual income taken as a percentage of the price. Because dependable, rising income sells at a lower yield, it fetches a higher price; a softer, oversupplied market trades at a higher yield, and so a lower price for the same income.
The listed office REIT market in India is still small next to the office stock that could feed it. It is best measured by floor space: only about 37% of REIT-eligible office stock across the top seven cities is listed, 198 mn sq ft of a 520 mn sq ft base.
Measured by value, the listed REIT market as a whole is larger, at a capitalisation of about ₹2.08 lakh crore across six listed REITs, per the Anarock report Powering the Next Decade (May 2026). Most of those trusts hold offices and one holds shopping centres, so that value sizes the whole listed market rather than the office segment alone.
The gap is not confined to office: across all institutional-grade real estate, only about 20% sits inside a listed REIT in India, against 96% in the United States, 55% in Singapore and 51% in Japan. Those mature markets matter here as a gauge of how far the listed market in India can still grow, because the wider the gap, the more privately held stock there is to move into listed hands over time.
As the listed pool grows, more stabilised offices, meaning buildings that are largely built, fully let
and already earning rent, can be sold into it. Anarock projects the Indian share climbing to 25-30% by 2030. The Securities and Exchange Board of India (SEBI) introduced the REIT framework in 2014 and has widened it since, giving private office holdings a listed exit route they historically lacked.
Room to grow is not a reason to buy on its own, though, because it only counts if the building itself would qualify to go into a REIT. The listed exit rewards the same Grade A quality the leasing market already prices, so demand, pricing and the exit all favour the same buildings. The one thing left to weigh is what could pull that alignment off course.
The 2026 outlook for offices
Owning the right Grade A office is still a sound call in 2026, but not a risk-free one. Three risks run through the 2026 outlook, and what they share is that each one bears on which buildings to own far more than on whether to own at all.
The three office market risks
The three risks, in order of how directly a buyer can manage them, are oversupply in Hyderabad, a shift in United States tariff and visa policy, and the concentration of demand in the southern corridor.
The first is Hyderabad, where supply and demand are still out of step. City vacancy stood at 23.5% in H1 CY2026 and the planned pipeline remains heavy. Buildings can therefore complete before there are tenants to fill them, and the rent a landlord can actually achieve in specific micro-markets then falls. An investor buying into Hyderabad on the national vacancy trend, rather than on the leasing profile of the individual building, takes on more risk of empty space than the headline suggests.
The second sits outside the property market, in United States policy. Workplaces 2025 notes that tariff and visa measures there have had little bearing on occupier activity so far. A sharper
shift could still slow GCC decision-making, and GCCs are roughly 40% of demand. Because GCC mandates run over several quarters, such a shift would not show up in leasing straight away. It would appear as a thinner pipeline two or three quarters later, once this year's decisions are already committed.
The third is concentration, which the national figures disguise because they look diversified. The southern corridor of Bengaluru, Hyderabad and Chennai took 58% of H1 2026 net absorption, or 15.8 mn sq ft, while NCR fell 15% to 4.3 mn sq ft. A portfolio built around the national headline is really a bet on three cities, and the smaller markets cannot offset it. Kolkata absorbed only 0.5 mn sq ft in H1 2026, so an 11% rise off that base changes very little.
Real diversification in office therefore has to come from the mix of asset types and the credit quality of tenants, not from spreading a portfolio across more Indian cities. Whether these three risks bear on the direction of the market or only on the choice of building depends on the economy they sit within.
A supportive economic backdrop
The wider economy is, for now, working in favour of owners rather than against them. India remains the fastest-growing major economy, with real GDP growth of 6.4% projected for 2026 by the International Monetary Fund in its July 2026 World Economic Outlook Update. The Reserve Bank of India (RBI) cut the policy rate through the last easing cycle and has held it at 5.25% ever since. Funding costs for income-producing assets stay below their recent peak.
Steady growth and a stable policy rate do not fix an oversupplied micro-market. They confirm, instead, that these three risks bear on which buildings to own rather than on the direction of the market as a whole. That turns the 2026 outlook into a set of choices rather than a single call.
The 2026 office investment playbook
City and asset selection is what the 2026 playbook comes down to. An investor buying office for stable income should concentrate on Bengaluru, Chennai and prime Pune, in buildings let to GCC or BFSI tenants. There, vacancy below 12% protects the rent and keeps space easy to re-
let when a lease ends.
Buyers with a higher risk appetite can do the opposite. Value-add and opportunistic funds can look at Hyderabad and NCR selectively, because the higher vacancy there brings the entry price down. A fund able to wait while that space is let can earn the difference.
Occupiers face the same conditions from the other side. They should commit to large space early in the tight cities and push for concessions on rent, fit-out and lock-in in the oversupplied micro-markets. There, a landlord with space to re-fill has more reason to give ground.
On either side of the deal, the same rule holds: the Grade A building that would qualify for a REIT is the easiest to sell later. That listed exit is set to widen, from about 20% of institutional-grade property today to a projected 25-30% by 2030.
In 2026, returns will be decided by city and building selection rather than by the market's overall direction. Broad office demand is expected to hold, so the risks and the rewards alike come down to which specific assets an investor owns. Bought that way, an asset can be held until the listed market has grown large enough to take it, at a strong exit price.
Key takeaways
- Growth should continue into 2026 at a more measured pace, built on record 2025 net absorption of 58.2 mn sq ft; with demand holding across sectors, the task is to choose the right cities and assets rather than to time the market.
- Investors buying for stable income should favour Bengaluru, Chennai and prime Pune, which on the H1 CY2026 city numbers carry vacancy of 10.8%, 8.6% and 11.4% respectively, tight enough to protect rents and keep space easy to re-let.
- Value-add and opportunistic buyers get a better entry price in Hyderabad (23.5% vacancy) and NCR (20.8%), in exchange for holding the asset longer while that space is let.
- Occupiers should commit to large space early in tight markets and push for rent, fit-out and lock-in concessions in oversupplied micro-markets.
- Grade A stock that would qualify for a REIT is the easiest to sell later: only around 20% of institutional-grade property in India sits inside a listed REIT today, and Anarock projects 25-30% by 2030.
- Watch three risks into 2026: the supply pipeline in Hyderabad, a sharper shift in United States tariff and visa policy, and the concentration of demand in the southern corridor, which took 58% of H1 2026 net absorption while NCR fell 15%.
Where this sits at Anarock
The commercial leasing and advisory practice at Anarock does this work with institutional investors and global occupiers: city and asset selection, deal structuring and portfolio strategy across commercial real estate India. Peush Jain and Anuj Kejriwal lead that practice and are quoted regularly on office demand and occupier strategy. See the Anarock coverage roundups on office leasing and occupier demand (August 2026) and on how commercial and retail occupiers are positioning (August 2026).
Methodology and coverage. The figures here cover Grade A office stock, the newest, highest-quality buildings that institutions buy. They span the top seven cities in India: Bengaluru, NCR, MMR, Pune, Hyderabad, Chennai and Kolkata. They run across calendar years 2024 and 2025 and the first half of 2026, the latest data available, and come from the Anarock research reports cited throughout.
Frequently asked questions
Is commercial real estate India a good investment in 2026?
The fundamentals are strong, but they support selective buying rather than broad exposure. Grade A office net absorption hit a record 58.2 mn sq ft in 2025, vacancy eased to 16.1% and
rents rose 6%, per Anarock x FICCI Workplaces 2025. With only about 20% of institutional-grade property held inside a listed REIT and a supportive economic backdrop, the case rests on city and asset selection rather than on broad market timing.
What is the office vacancy rate in India in 2026?
Pan-India Grade A office vacancy eased to 15.0% by H1 2026, from 16.1% at the end of 2025 and 16.5% a year before that, per Anarock. The average masks a wide spread: on the H1 CY2026 city numbers, Chennai was tightest at 8.6% and Hyderabad weakest at 23.5%, with Bengaluru at 10.8% and NCR at 20.8%. Buying decisions into 2026 turn on that spread rather than on the headline figure.
Which is the largest office market in India?
Bengaluru is the largest office market in India. It holds roughly 215 mn sq ft of Grade A stock, about 27% of the total across the top seven cities. It led all markets in H1 2026 with 8.3 mn sq ft of net absorption, up 26% year on year, per Anarock India Office Market Update H1 CY2026. It also captured more than one-third of national GCC leasing in 2025.
How big is the GCC market in India?
India hosts more than 1,700 Global Capability Centres employing over 1.9 million professionals, and the market grew from $30 bn in 2019 to about $64 bn in 2024, per Workplaces 2025. Industry estimates compiled by Anarock project $105-110 bn and more than 2,400 centres by 2030, at a 10% CAGR.
What are office rents in India?
Pan-India Grade A office rent averaged ₹92 per sq ft per month in 2025 and reached ₹96 by H1 2026, 9% above the ₹88 recorded in H1 2025, per Anarock. MMR remains the costliest market in India, while Bengaluru has the highest rental index nationally at 137.2 on a 2021 base. Across cities, calendar-2025 rent growth ran from 3-9%.
How much of the office demand in India do GCCs drive?
Global Capability Centres are the largest occupier group. They took a little over 32.5 mn sq ft of the 80.5 mn sq ft leased across the top seven cities in 2025, roughly 40% of activity, per Workplaces 2025. That share rose again in H1 2026: GCC leasing grew 22% to 19.2 mn sq ft and made up 45% of gross leasing, against 41% a year earlier, per Anarock India Office Market Update H1 CY2026.
Sources
- Anarock Research, India Office Market Update H1 CY2026 (published July 2026).
- Anarock x FICCI, Workplaces 2025: India Commercial Real Estate Reimagined (February 2026).
- Anarock Research, India Office Market Annual Update CY2025 (February 2026).
- International Monetary Fund, World Economic Outlook Update, July 2026.
- Reserve Bank of India, monetary policy statements and commercial real estate credit data.
- Securities and Exchange Board of India (SEBI), REIT Regulations 2014 (as amended).
- Anarock, Anarock leaders on office leasing and occupier demand, media coverage roundup, August 2026.
- Anarock, Anuj Kejriwal on how commercial and retail occupiers are positioning, media coverage roundup, August 2026.