
10 Min Read
07 October 2026India office market update: H1 CY2026
Share
Table of Contents+
Introduction
The office market in India is no longer the tenant's market it was for much of the past decade. New construction in the leading cities once ran ahead of the firms taking space, so an occupier could sign in a half-empty tower and push hard on rent. The best buildings are now the ones companies compete to get into, and developers have turned cautious about building on spec.
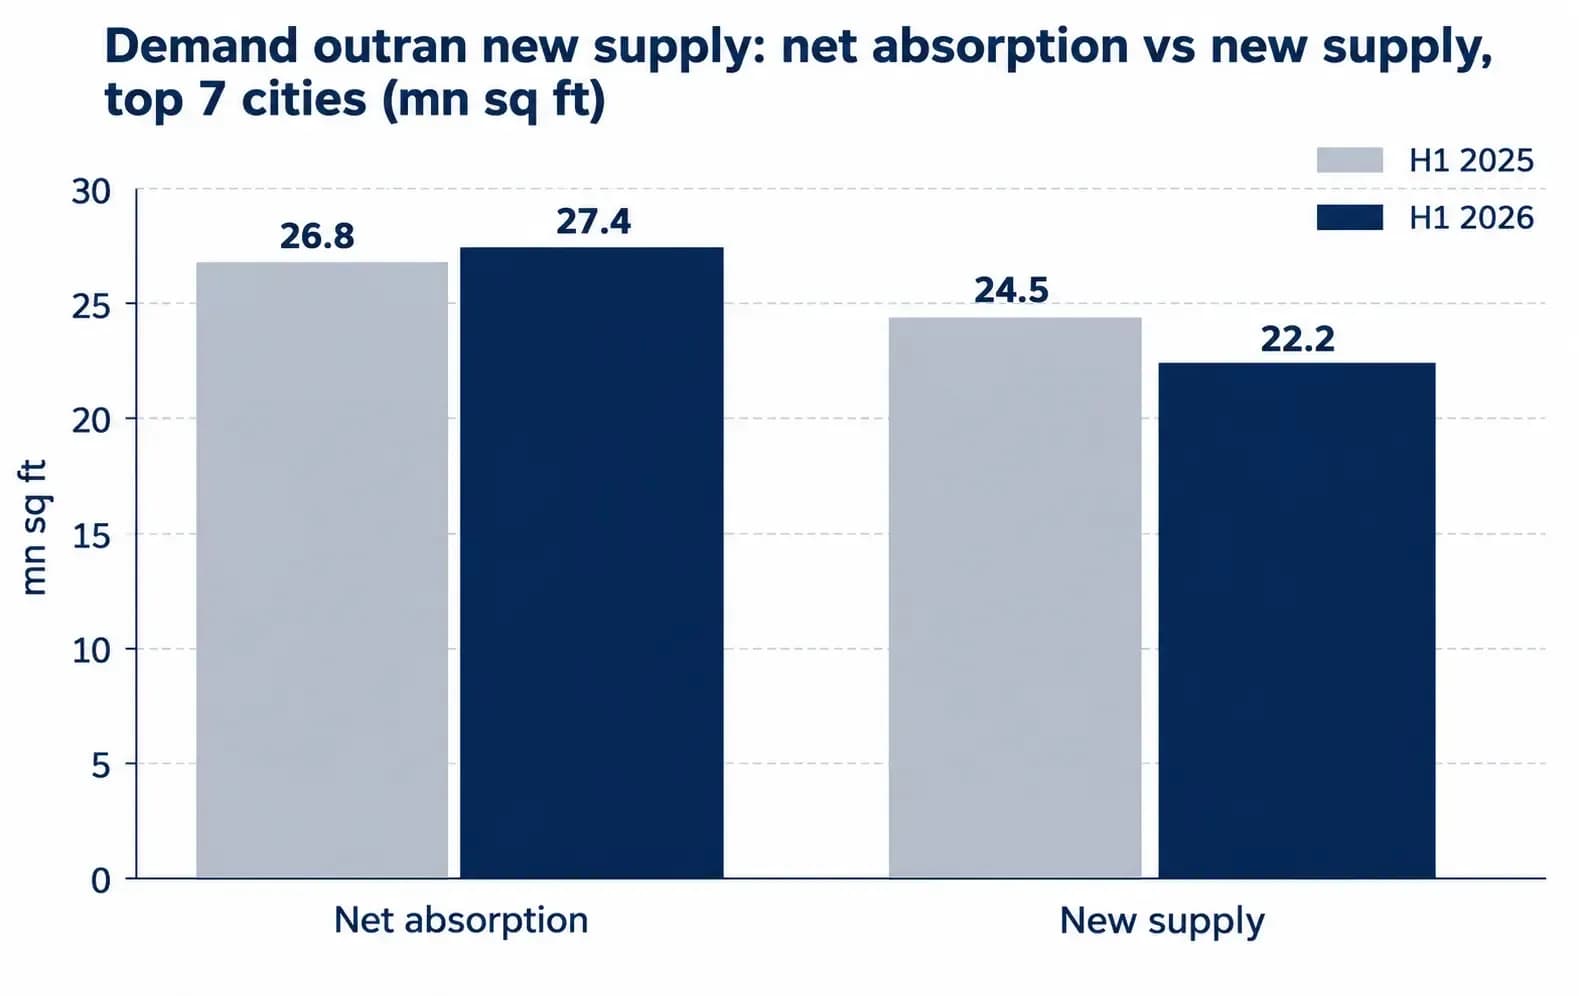
Companies took up 27.4 mn sq ft of office space across the top seven cities in the first half of 2026, and the global capability centres that multinationals run from India drove more of the leasing than any other kind of occupier, even as developers delivered less new space than a year before. The Anarock India Office Market Update H1 CY2026 maps where that demand landed, who drove it, and what a market with more takers than space means for occupiers and investors.
| Metric, top seven cities | H1 2026 | Change on H1 2025 |
|---|---|---|
| Net office absorption | 27.4 mn sq ft | up 2% |
| New supply | 22.2 mn sq ft | down 10% |
| Average vacancy | 15.0% | down 1.3 percentage points |
| Average office rent | ₹96 per sq ft a month | up 9% |
| GCC share of office leasing | 45% | up from 41% |
Demand pulled ahead of supply
Developers could not keep pace with occupiers this half. Net absorption, the space occupiers newly take up once vacated space is netted off, reached 27.4 mn sq ft, 2% above the 26.8 mn sq ft of a year earlier, while new supply fell 10% to 22.2 mn sq ft. That left demand 5.2 mn sq ft ahead of completions and drew down space that earlier cycles had left empty, per the report. For an occupier the consequence is immediate. With little new space arriving and vacant stock being taken up, a tenant renewing in the leading cities has less room to push back on rent than
last year. That tightening is not spread evenly, and where the demand actually landed was far from even across the seven cities.
The map of demand redrew itself
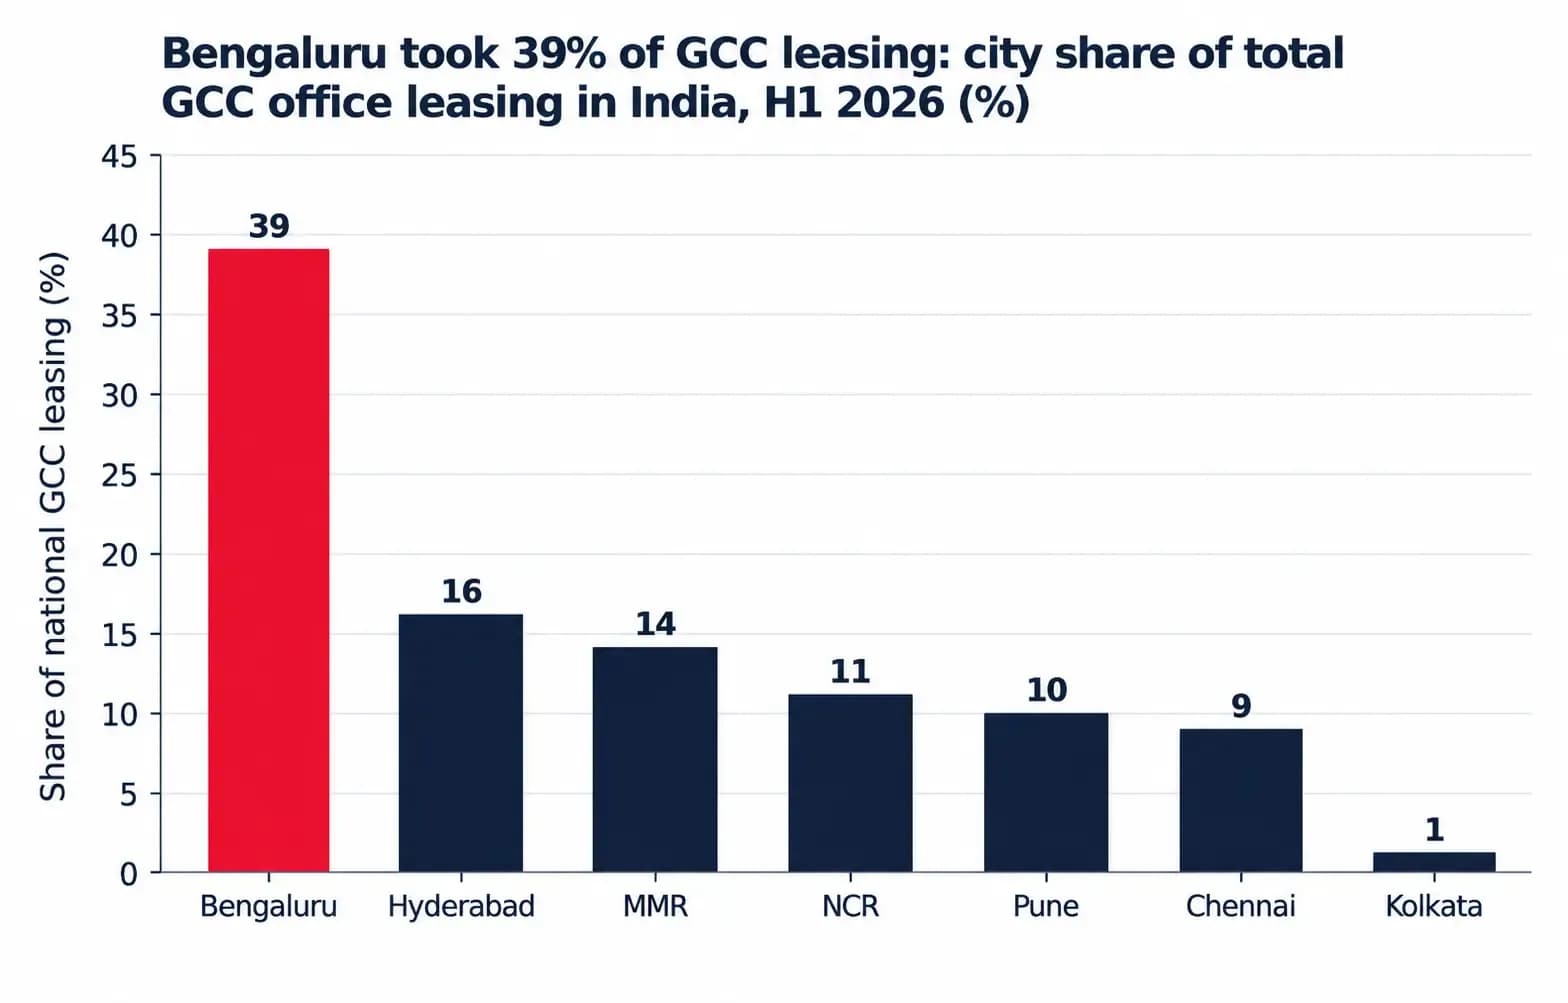
Bengaluru pulled in the largest share of that demand, filling 8.3 mn sq ft, or 30% of the national total, up 26% on a year earlier and anchored by the GCC and technology occupiers that cluster there. Just behind, Hyderabad advanced 24% to 5.2 mn sq ft and, on a 19% share, overtook both the Mumbai Metropolitan Region (MMR) and the National Capital Region (NCR) to rank second; the southern cities together took 58% of all absorption. The three markets that led earlier cycles all lost ground: NCR absorption fell 15% to 4.3 mn sq ft, MMR eased 4% to the same level, and Pune, off a strong base, dropped 33% to 2.6 mn sq ft. Kolkata took 1% of national GCC leasing, the smallest share among the seven cities. The order of cities by demand has reordered in a single year, so an occupier siting new space now has to read where demand is heading, not where last year's ranking put it. For a developer the signal is sharper still, because building where demand has already peaked, rather than where it is heading, is how the vacant stock of earlier cycles was created in the first place. That leftover stock is also why the market still carries real vacancy, and why its rents behave in a way the vacancy rate alone does not explain.
Scarcity, not vacancy, is setting rents
Rents followed scarcity, not the vacancy rate. Average vacancy across the seven cities eased to 15.0% in H1 2026, down 1.3 percentage points from 16.3% a year earlier, and every city improved, from Chennai at a tight 8.6% to Hyderabad, still the weakest at 23.5%, nearly three times the rate in Chennai. Yet average rent rose 9% over the year to ₹96 per sq ft a month, and rents and vacancy rarely moved together. NCR rents rose 10.3% even on vacancy of 20.8%, and Bengaluru and Hyderabad each rose more than 10%, because landlords in the prime corridors hold their pricing while weaker, older stock stays unlet. The national average also understates the top of the market: MMR remains the costliest address in India at ₹154 per sq ft a month, so an occupier budgeting off the ₹96 figure will misprice prime space in the city that matters most to it. That prime scarcity comes down, above all, to the Global Capability Centres.
Global capability centres are the engine
The demand keeping those rents firm comes above all from one occupier group: GCCs, the offshore offices that multinationals run in India. Their gross leasing, which counts every deal signed and so runs wider than net absorption, rose 22% to 19.2 mn sq ft, a record 45% of the half's office leasing, up from 41% a year earlier, with Bengaluru alone taking 39% of it. Hyderabad and MMR follow at 16% and 14% of national GCC leasing, so two-thirds of that demand lands in just three cities, which is why a pre-let building in one of them can be spoken for before it is finished. Around them no single traditional sector still dominates: information technology and IT-enabled services (IT-ITeS) slipped to 26% of leasing from 29%, flexible-space operators, the managed-office and coworking firms that lease floors to sublet, rose to 25%, and banking, financial services and insurance (BFSI) reached 19%. On the leasing mandates we run, the binding constraint in these GCC-heavy micro-markets is no longer rent but whether a pre-committed building completes on time. One caveat sits behind the 45% headline: because much GCC demand is also counted under BFSI, manufacturing and consultancy labels, the sector totals understate how much space this one group really drives. GCCs are not the only occupiers those labels miss, though; the second is a group the market long dismissed as a stopgap.
Flexible space stopped being a stopgap
Behind that occupier list sits a change the market once treated as temporary. Flexible-space operators took a quarter of all office leasing in H1 2026, second only to GCCs and ahead of every traditional corporate sector, and in NCR, Bengaluru and Pune they are already the single largest occupier group. For a landlord that reads as a durable line of demand rather than a stopgap between corporate deals, because operators keep leasing through the cycle to hold fitted space ready for their own clients. The appeal for the corporate is the mirror image: it can add or shed floors as headcount moves and turn what would be a capital commitment into a monthly cost, which is exactly what a business scaling a GCC wants. In practice the two engines feed each other, because operators fit out floors in the same GCC-heavy cities, giving a fast-scaling centre somewhere to land while its own building is under construction. The practical effect is that the operator, not only the corporate tenant, is now a counterparty in its own right. An investor buying an office asset has to price that operator too. For the rest of 2026 the desk expects flexible space to stay a permanent feature of demand rather than a passing one.
Outlook for the rest of 2026 and into 2027
The forces that tightened the market are set to run on. The Anarock report expects:
- Vacancy should keep easing through the rest of 2026, as long as developers hold the supply discipline that cut completions 10% this half.
- GCCs should stay the main engine of demand into 2027; their leasing grew 22% in H1 2026 against about 11% for the market as a whole.
- Rent growth should stay uneven, set by the scarcity of high-quality, well-located space rather than by any single city's vacancy rate.
- Southern cities should keep absorbing the bulk of new demand, on the GCC and technology base that already gives them 58% of the national total.
- Flexible-space demand looks structural rather than temporary, which keeps a floor under leasing even if any one corporate sector slows.
So supply, not demand, is the constraint for the rest of 2026: with completions still 5.2 mn sq ft behind take-up, the market tightens further unless more high-quality space is delivered, and the leasing advantage stays with the landlord that already owns it.
What this covers
The Anarock India Office Market Update H1 CY2026 covers Grade A office space, meaning the highest-specification, institutionally-managed buildings. It spans the top seven cities of India - Bengaluru, MMR, NCR, Hyderabad, Chennai, Pune and Kolkata - for January to June 2026, with data as of 30 June 2026. Figures are net absorption unless the text says gross leasing. The full report carries city-wise tables, micro-market rents, key lease transactions and the time series back to 2021.
Download the full report Anarock India Office Market Update H1 CY2026 to get a full picture on the commercial real estate market in India.
Frequently asked questions
What was office space absorption in India in H1 2026?
Net office absorption across the top seven cities reached 27.4 mn sq ft in H1 2026, up 2% year on year, per the Anarock India Office Market Update H1 CY2026. New supply fell 10% to 22.2 mn sq ft, leaving demand 5.2 mn sq ft ahead of completions and drawing down vacant stock built up in earlier cycles.
Which city led office absorption in India in H1 2026?
Bengaluru led with 8.3 mn sq ft of net absorption in H1 2026, 30% of the national total and up 26% year on year, per the report. Hyderabad ranked second at 5.2 mn sq ft, up 24%, overtaking MMR and NCR, and the southern cities together took 58% of national absorption.
What is the office vacancy rate in India in 2026?
Average office vacancy across the top seven cities eased to 15.0% in H1 2026, down 1.3 percentage points from 16.3% a year earlier, with every city improving, per the report. Chennai was the tightest at 8.6% and Hyderabad the weakest at 23.5%, so the national average covers a wide spread.
How much did office rents rise in India in H1 2026?
Average Grade A office rent rose 9% year on year to ₹96 per sq ft a month in H1 2026, per the report. NCR posted the sharpest growth at 10.3%, and Bengaluru and Hyderabad each rose over 10%. MMR remained the costliest market in India at ₹154 per sq ft a month.
How much office space did GCCs lease in India in H1 2026?
Global Capability Centres leased 19.2 mn sq ft of gross office space in H1 2026, up 22% year on year and a record 45% of all leasing, up from 41%, per the report. Bengaluru took 39% of national GCC leasing, with Hyderabad and MMR the fastest-growing GCC markets this half.
Related research
- India Office Market Annual Update CY2025 - the full-year backdrop.
- Bengaluru: Where Talent Meets Capital - why the city leads office demand.
- GCCs and data centres are redrawing the real estate map in India - Peush Jain on the GCC shift.
- Commercial Leasing and Advisory - the Anarock office leasing practice.
Sources
Anarock, India Office Market Update H1 CY2026, July 2026 (data as of 30 June 2026) - all market figures on this page.